June has been a big month for Hexiosec ASM with the release of two much-requested features: asset tagging and a cross-scan dashboard.
Both of these features can help you to understand your data better, and give you more flexibility around how you organise and prioritise your risk remediation efforts.
Tagging domains and IPs
You can now tag domains and IPs in your scans to help apply your specialist knowledge to your results. This can help you to organise your results, especially when you have a particularly large attack surface with lots of risks. Applying tags that reflect things like ownership and business criticality, can help to make the data more meaningful to your business and help you to make informed decisions about where to focus your resources.
Adding tags
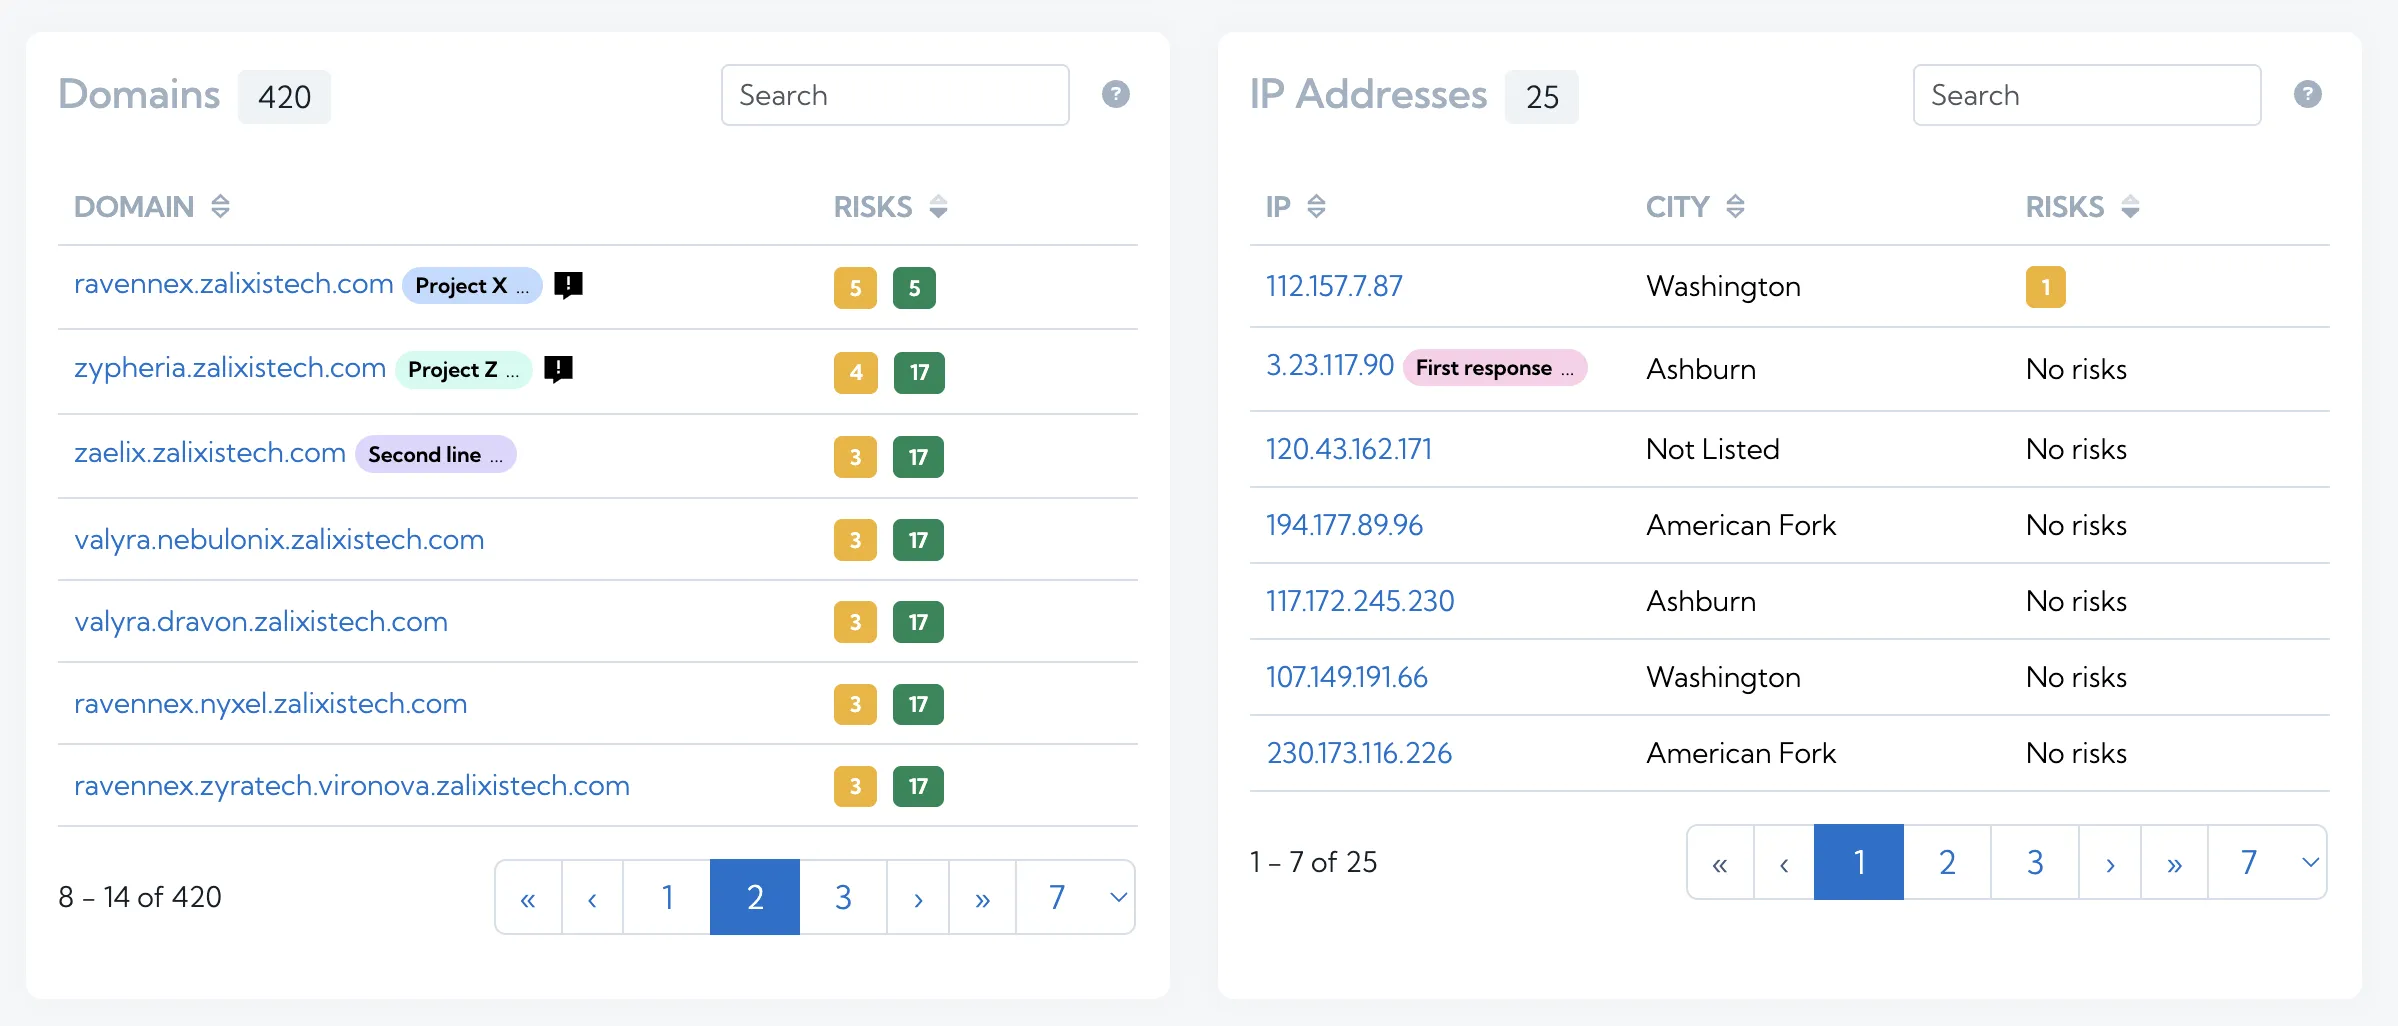
Tags you’ve applied are shown on the widgets on the scan overview page to visualise the context you’ve added.
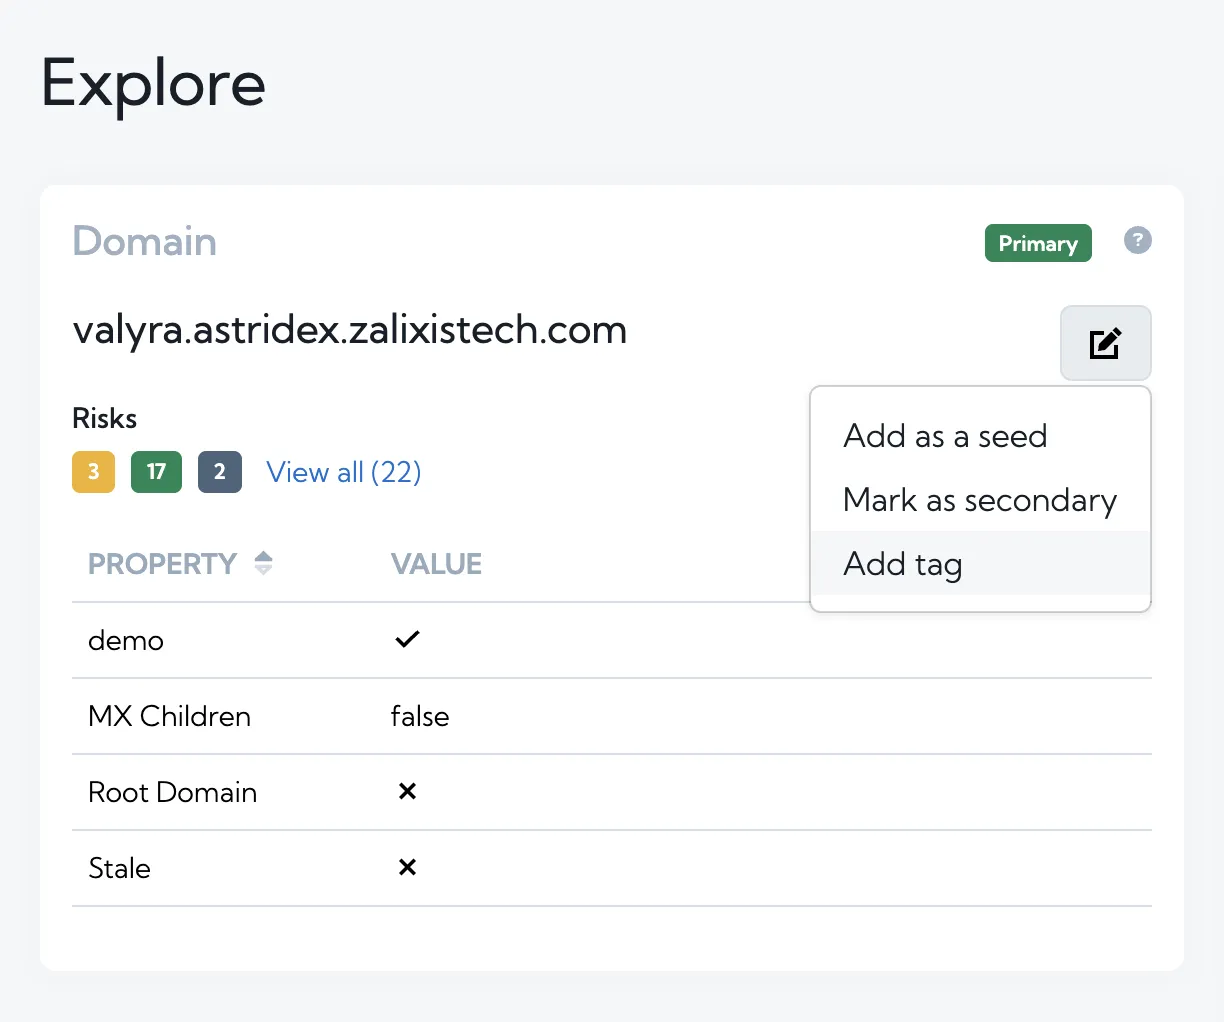
You can add tags from the Explore page for an IP address or domain…
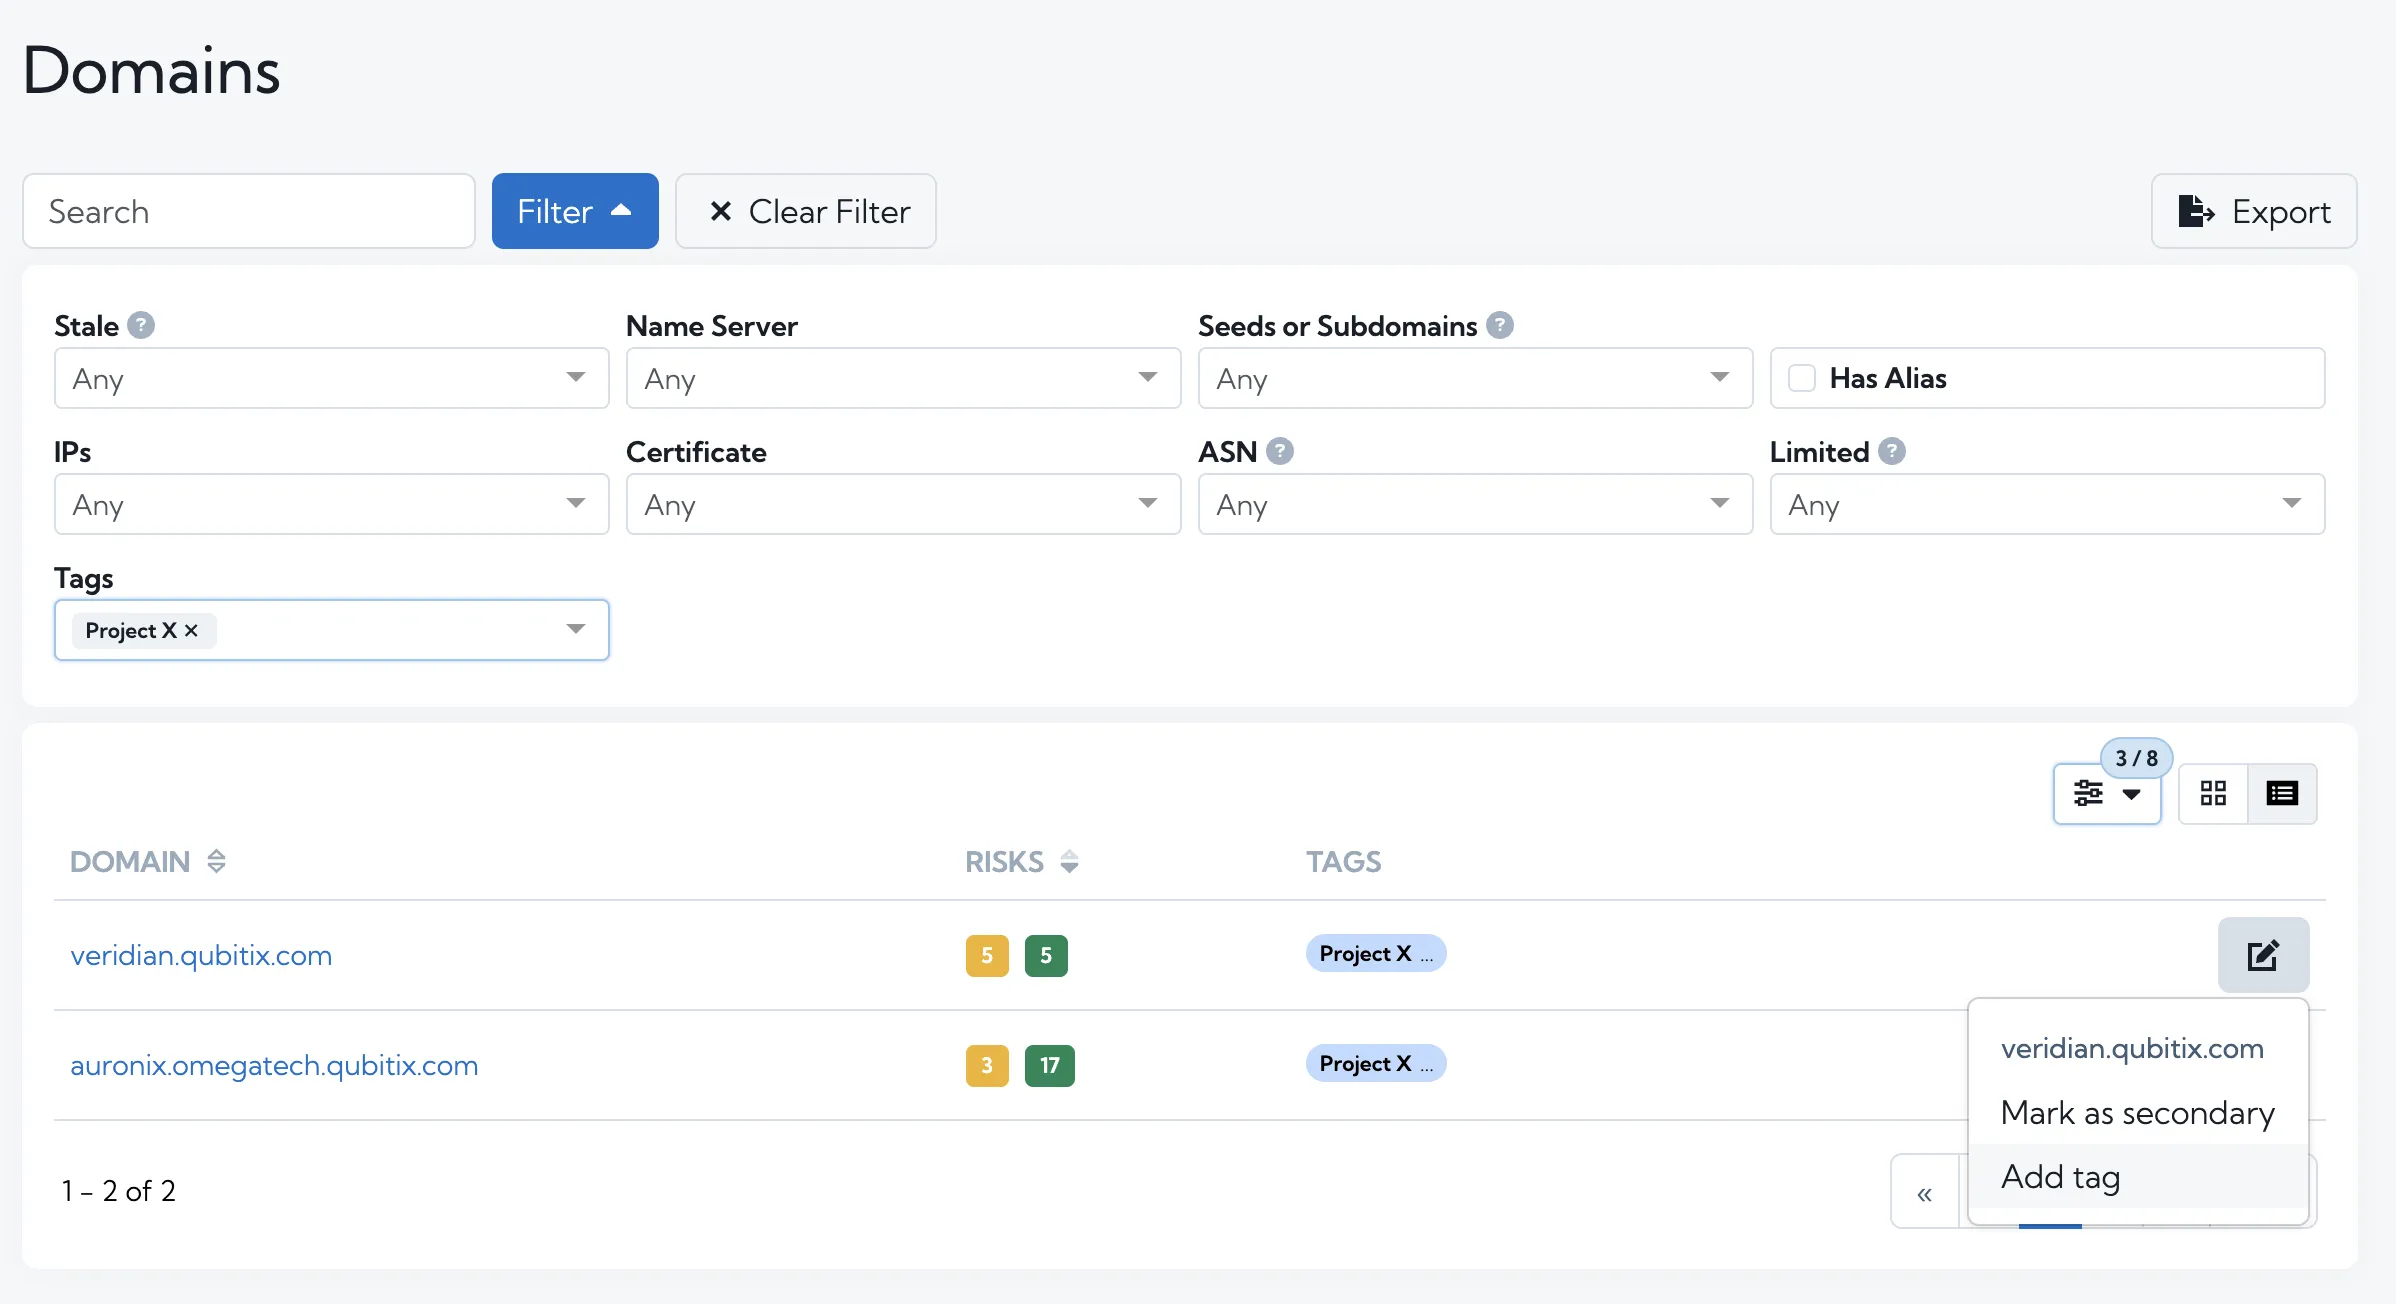
and also from the Domains and IPs pages, where you can also filter by tags as well.
Anyone with Admin or Editor roles for a scan can add and remove tags on domains and IPs quickly and easily. Tags that have been added can be seen by all users with access to the scan.
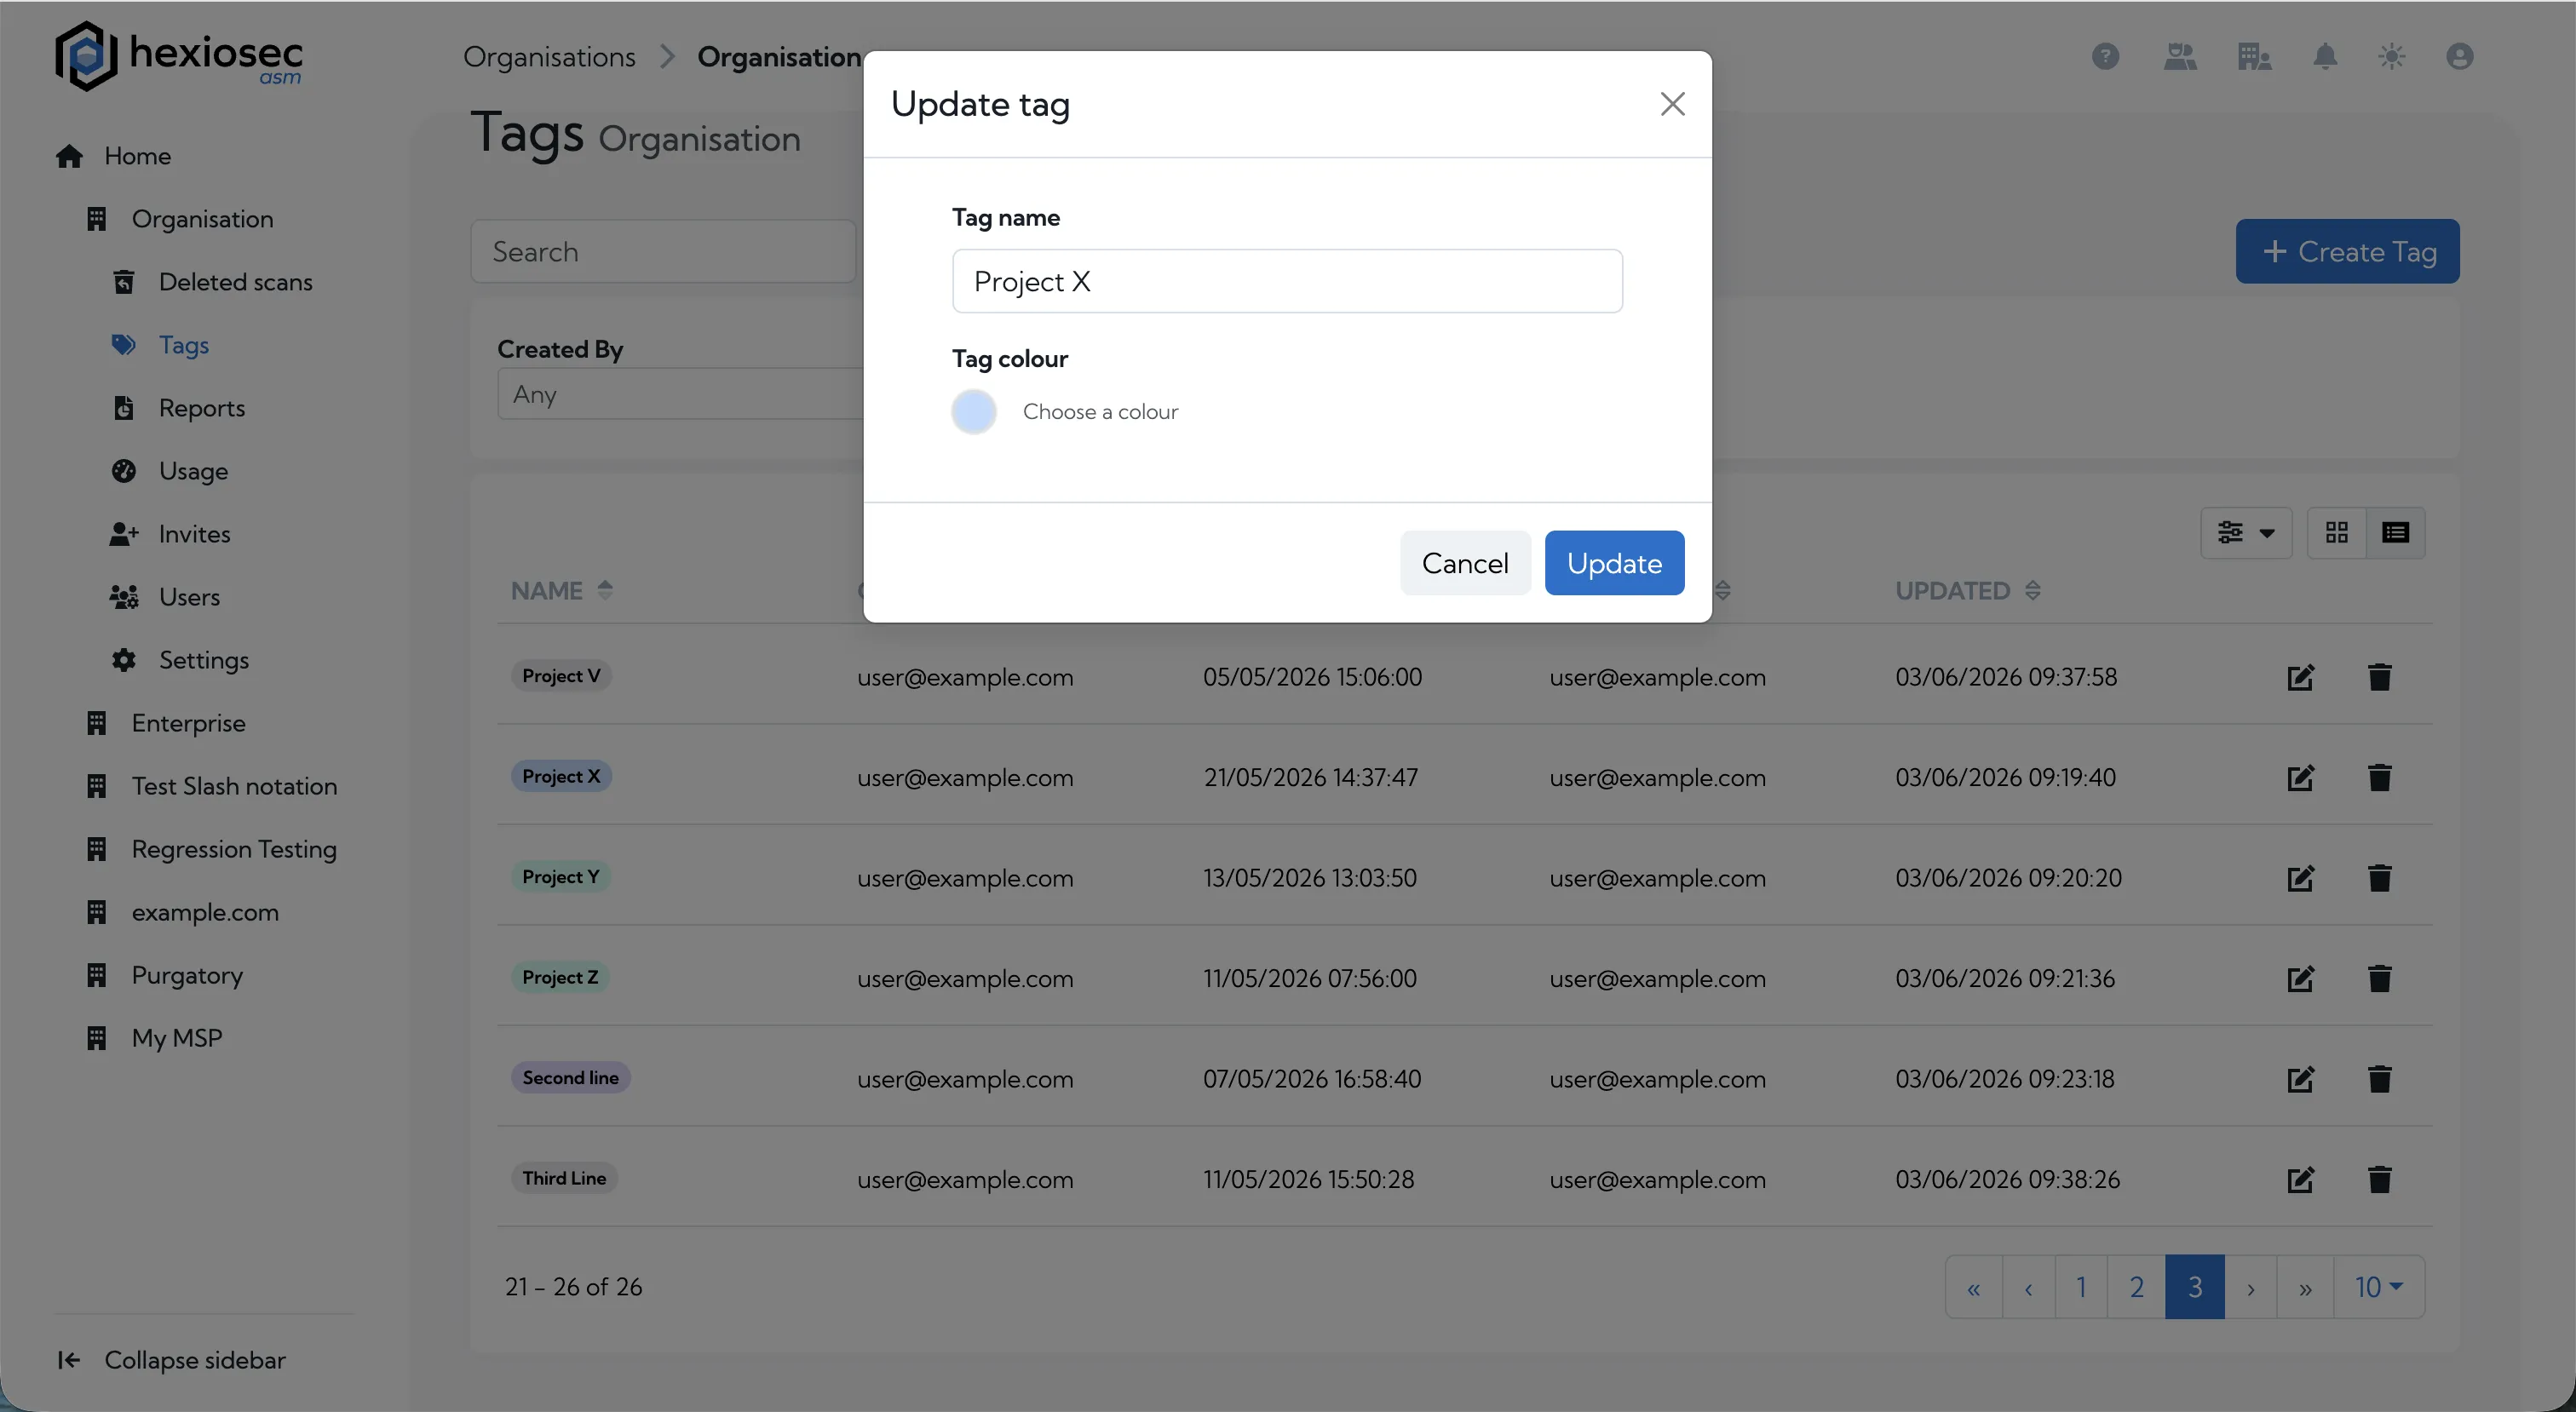
Tag management
Tags can be managed at the Organisation level and requires either Organisation Owner, Admin or Manager privileges. Under your organisation settings you can create, delete, rename and apply different colours to tags.
When a scan produces a lot of results, it can be quite difficult to manage the results as there is so much to look at. Allowing you to add tags allows you to focus your time and effort more efficiently. We will be adding more functionality and capability to tags in the future, and would love to hear any use cases you may have for them that we can try to accommodate in the next phase.
Cross-scan dashboard
In February, we announced a beta version of the cross-scan dashboard was available. Since then, we have been refining it and are now excited to announce we are rolling it out to all Premium, Enterprise and MSP users.
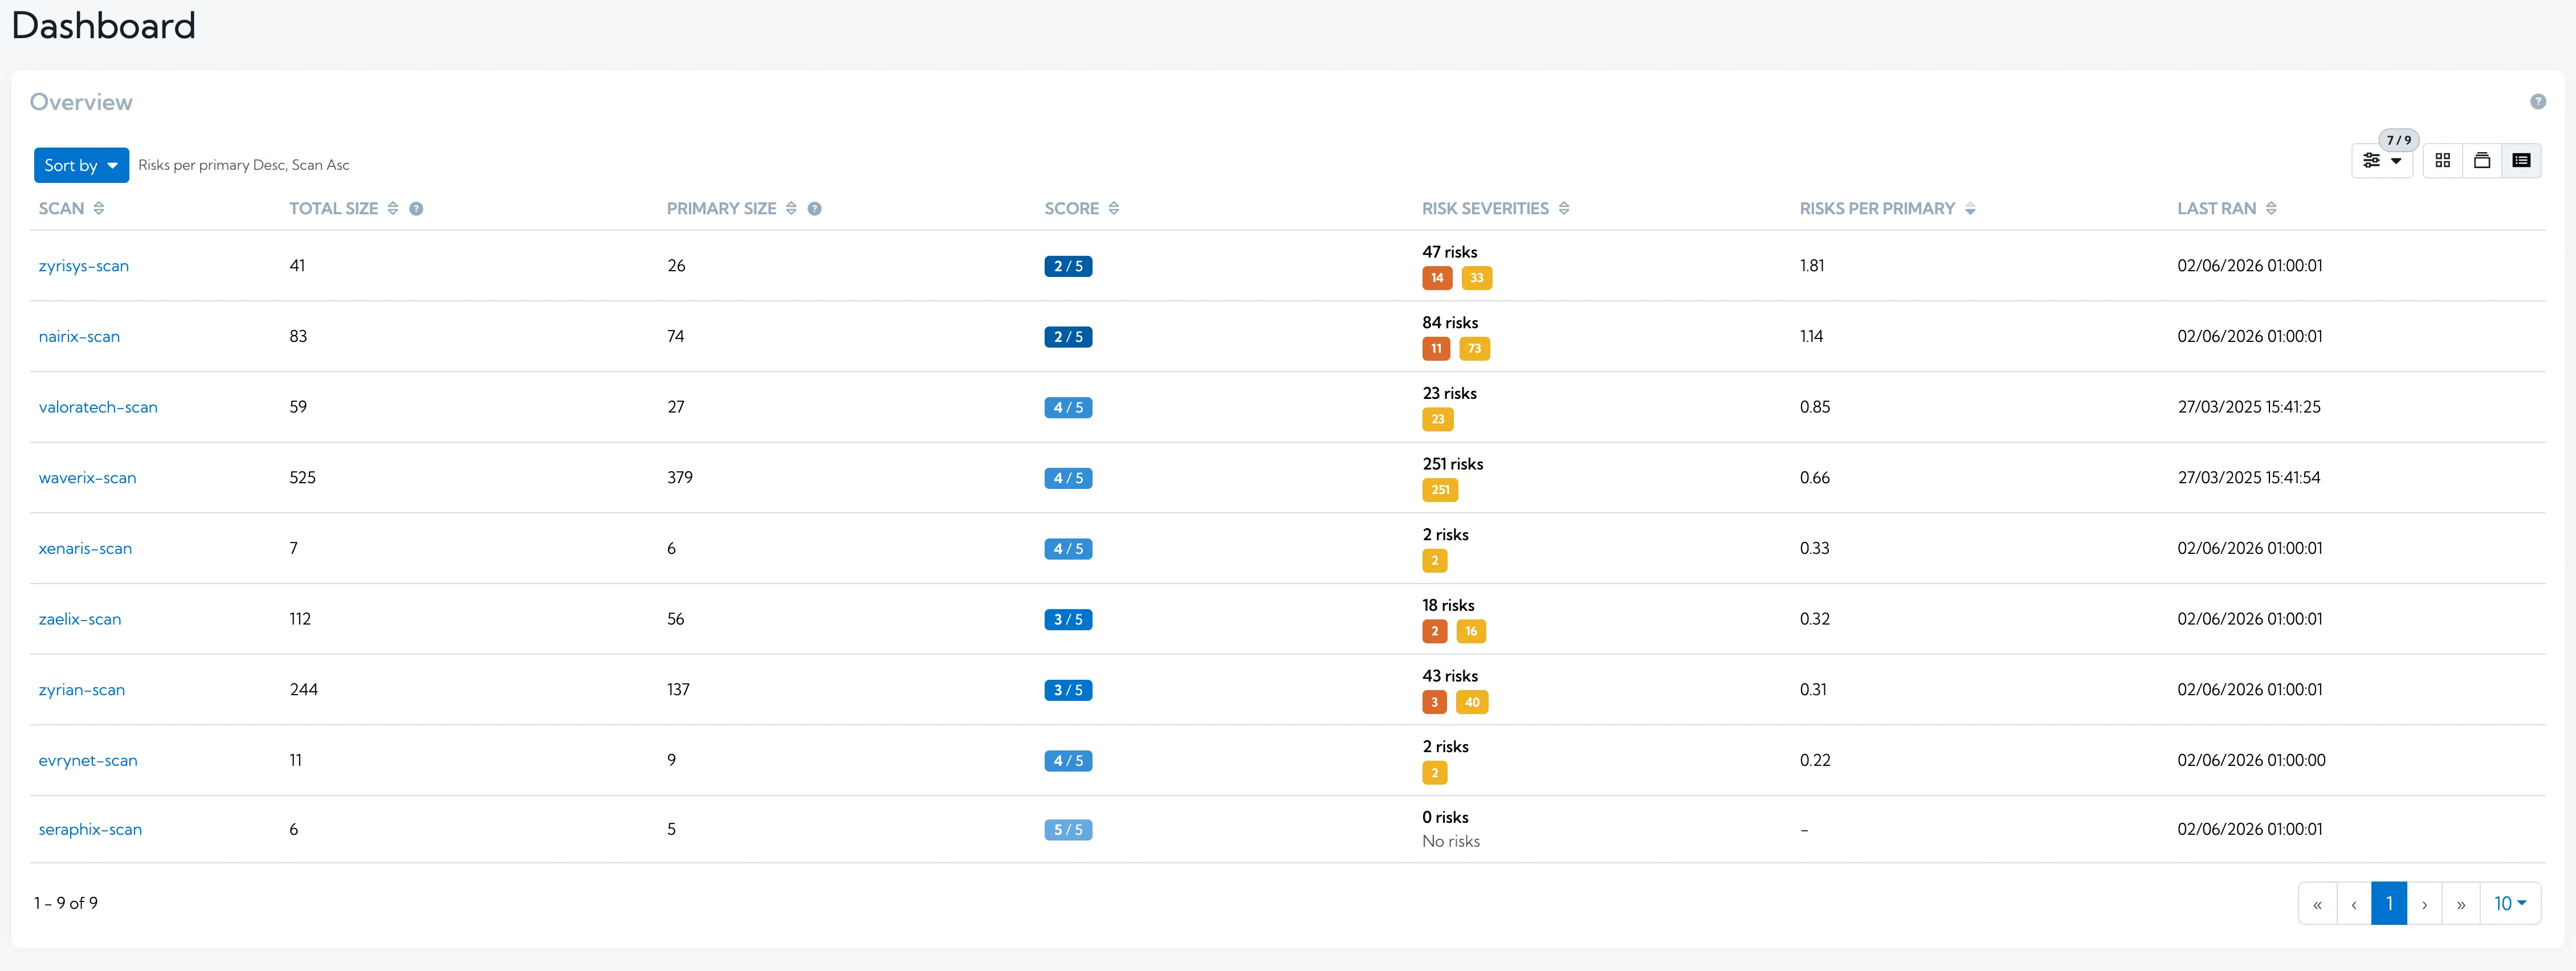
The dashboard allows you to choose multiple scans to view and compare side by side. This dashboard can be powerful in a number of scenarios:
For a large business with multiple subsidiary brands, so you can see all your key data in one view.
For MSPs, you can look at your portfolio of customers in one view and see where your attention is most required.
For everyone, view your key suppliers in one place to understand your supply chain risk.
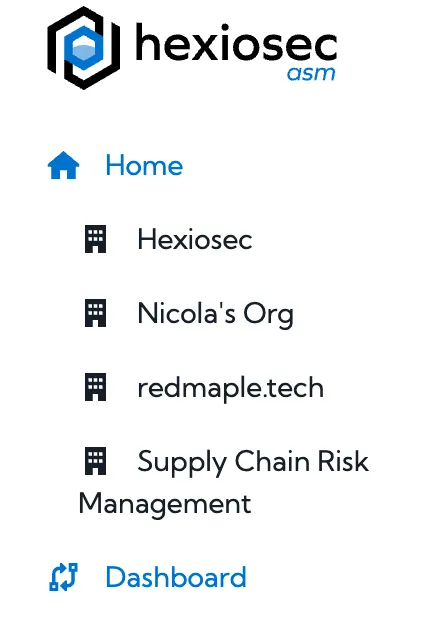
The dashboard can be accessed in the navigation bar on the left
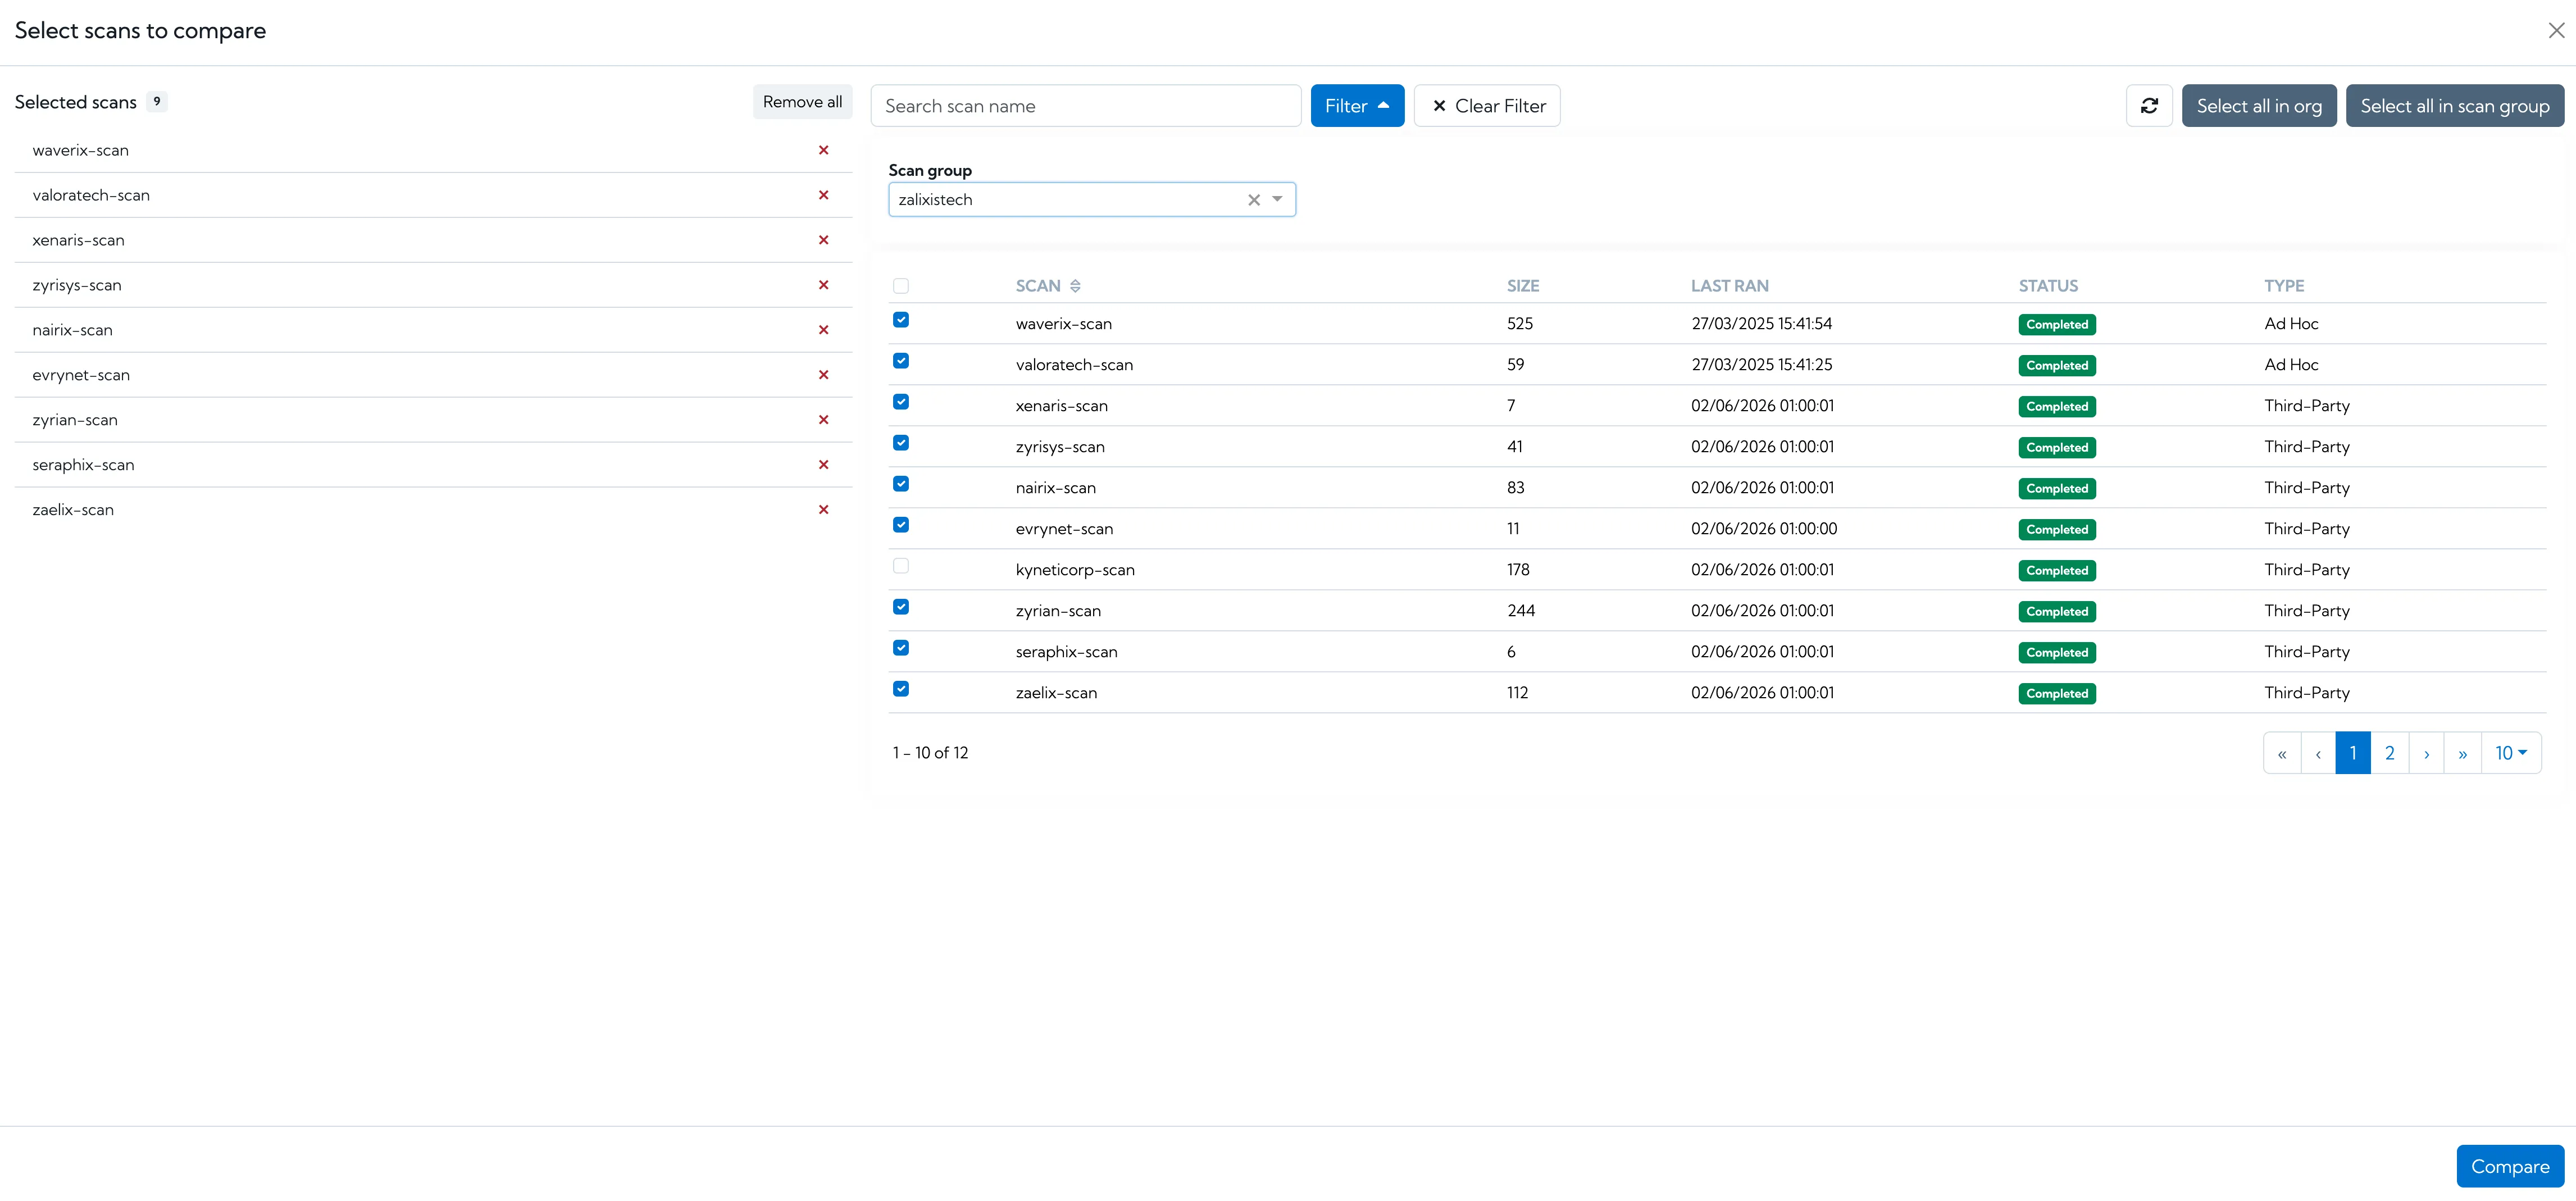
You can select which scans to view on the dashboard by searching or filtering based on scan group.
Based on the scans you’ve selected, you can view, sort by and compare some key figures:
Scan size (number of primary domains and IPs discovered)
Health score
Number of risks, by severity and category
Number of risks per asset (risks per primary)
Across the selected scans, you can also see:
The domains with the most risks
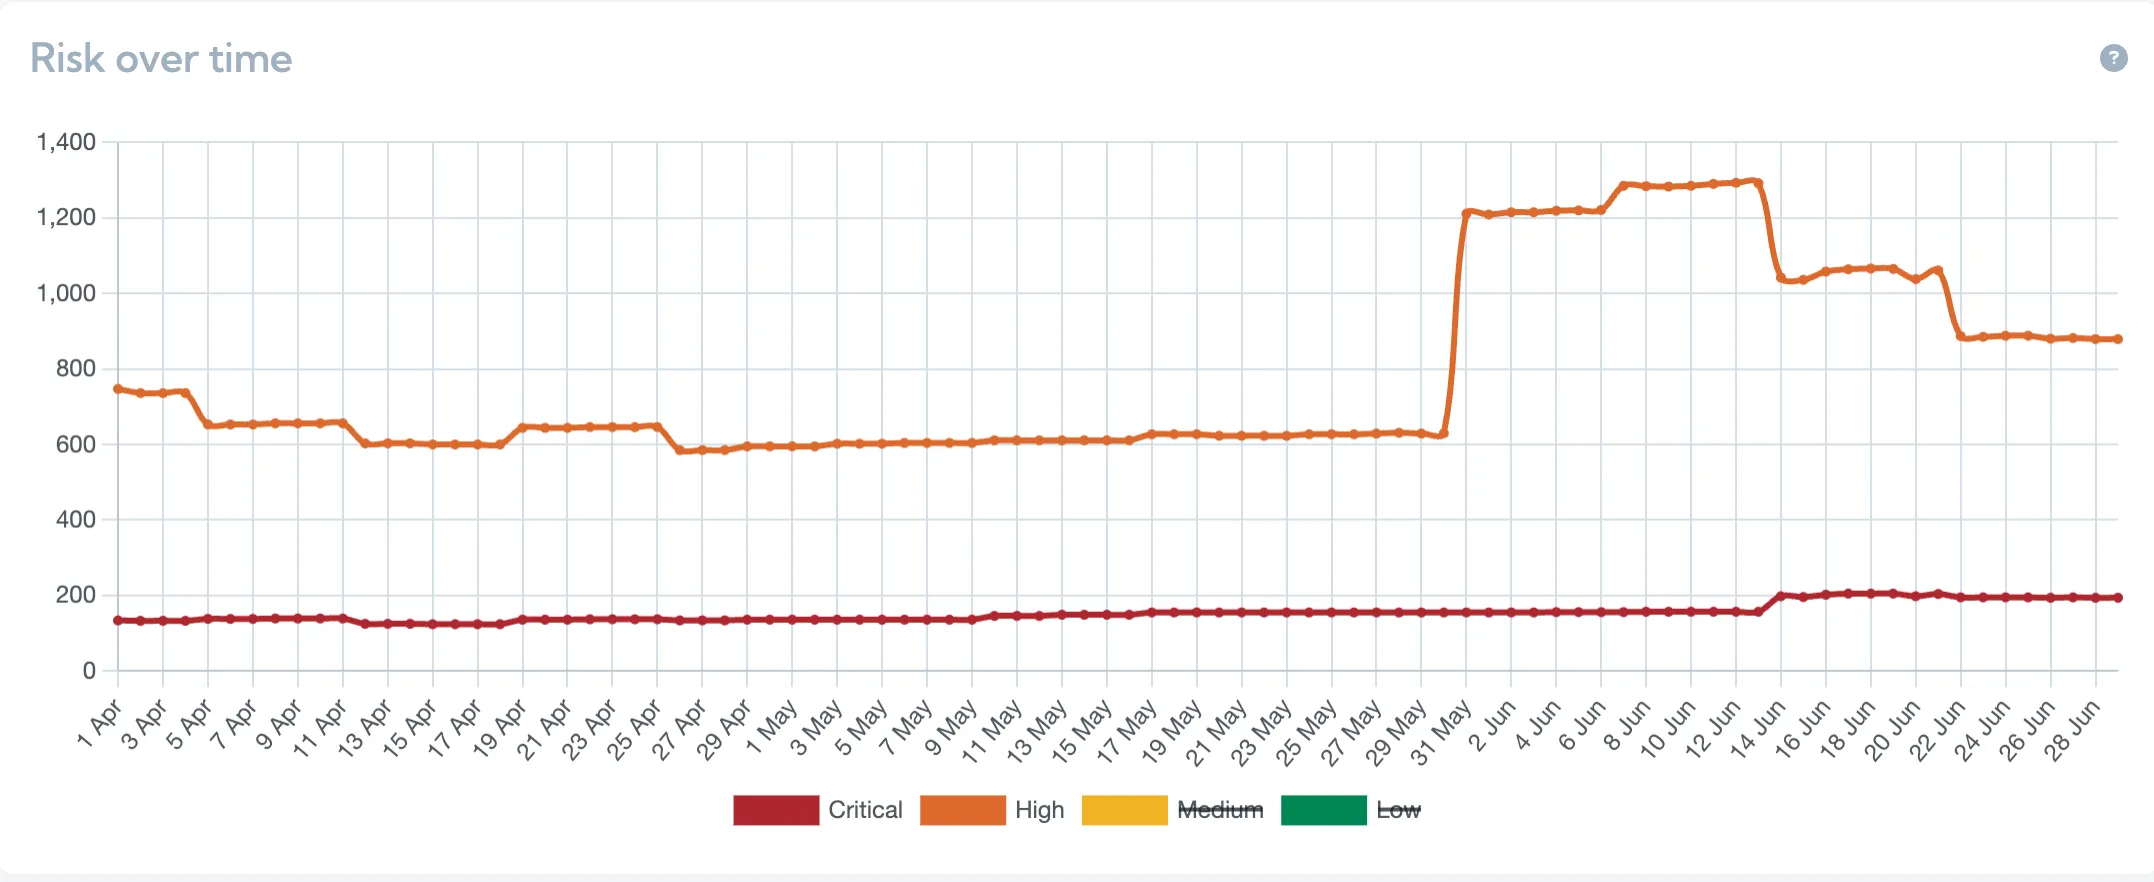
Total risks over time, by severity
Newest risks, by severity
If there are scan collections you use regularly, you can bookmark the URL so you can easily return to the same view. Saving views of scans in the app is a feature we will be adding in the future.
During the next phase of development, we will be adding Scan Metrics (as seen for individual scans in our May blog) to give you even more power to sort your data by the figures that are important.
With the release of these two big features, we are more keen than ever to hear your feedback. Please let us know if there are any additional tagging or dashboard capabilities you would find useful, and we will take it on board for our next phase of development.
Coming soon
We’ve got some exciting features coming over the next couple of months. Please get in touch if there are any features you would like to see us add to our roadmap.
Scan metrics on the cross-scan dashboard - see the key metrics side by side for multiple scans at once, and see how these values are changing over time.
Improvements to free accounts - to help smaller organisations to keep an eye on their attack surfaces without the cost.
Nicola is the Product Manager for Hexiosec, working closely with the engineering teams
to represent our customers' and users' needs across both Hexiosec ASM and Hexiosec Transfer. She has over 10 years product management experience building products to help
solve real world problems for businesses.
Scan your domain to get an instant, no-registration snapshot of your internet-facing assets.